The Urban Land Institute in the San Francisco Bay Area surveyed 701 adults in the nine-county region, through live interviews on landlines and cellphones in February this year. You can access it here [PDF]. The results say a lot about the regional housing shortage and clear desire for transit-oriented housing.
According to the study, only 40 percent of respondents have confidence in the affordability of the region’s housing, compared to 56% for residents in similar-sized regions around the country. That really speaks to the severity of the housing shortage in the region, particularly for millennials. Put another way, almost two out of three residents feel the area is unaffordable.
The survey also reveals a clear demand for walkable, infill-oriented communities:
- 68% place a high or top priority on walkability for a home, compared to 50% nationally
- 50% want convenient access to transit from their home, compared to 32% nationally
- 50% want more bike lanes in their community, compared to 48% nationally
- 74% satisfied with existing housing types, compared to 81% nationally
Some obvious policy responses to this survey: build more walkable, transit-friendly communities, and build a lot of them — quickly. Of course, easier said than done, given that local governments routinely resist this development.
It’s been fashionable of late to decry the idea of rich people buying luxury condos in our cities, driving up rents and taking away affordable housing opportunities. From a transit perspective, an influential study from TransForm showed that it’s best to locate affordable housing near transit if you want to boost ridership and lower greenhouse gas emissions. Rich people, the study suggests, don’t really ride transit. And few people like the idea of a vertical Beverly Hills going up in their neighborhood.
I don’t argue with these conclusions, but I think we need to be mindful of a few things. First, we don’t want to segregate low and moderate-income people around transit nodes in homogenous communities. For healthy, functional communities, we need people and families with a mix of incomes in close proximity.
Second, all this affordable housing comes with significant public subsidy, so we need to be honest about how we’re going to pay for it. More developer fees? Fees on real estate documents? Bonds? There are potentially less-expensive options to help make housing affordable, like boosting the supply at all income levels in our cities (which helps solve many other challenges, such as economic inequality and sprawl).
But a third thing to keep in mind is that rich people are huge resource hogs, and helping them live in infill, urban areas offers numerous environmental benefits. As my UC Berkeley colleagues documented last year, suburban sprawl is terrible for carbon emissions, compared to urban development.
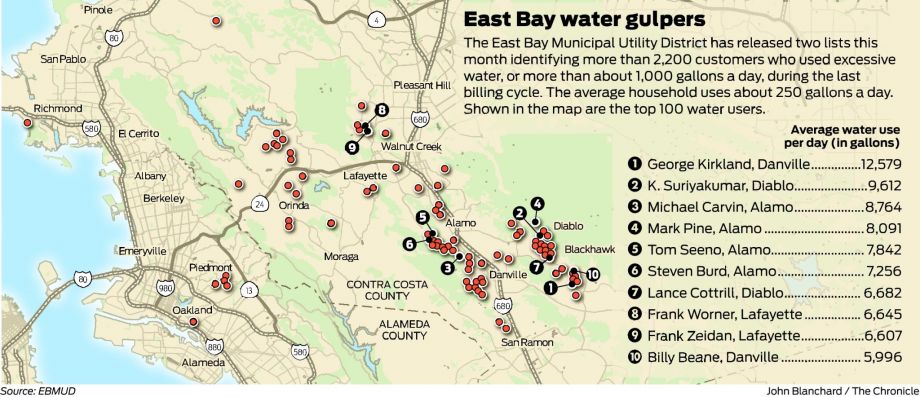
But it’s not just about carbon. Case in point: in the Bay Area’s East Bay, the water utility just released a list of the biggest water guzzlers who have been fined for their excess. And guess where the top water-wasters are? Out in the suburbs, not in the cities:
The top water user, amid a fourth year of extreme drought that has caused farmers to fallow fields and wells to go dry, was Kumarakulasingan “Suri” Suriyakumar, president and chief executive of ARC Document Solutions, a Walnut Creek software company that caters to the construction industry. Records show he consumed 9,612 gallons a day at his eight-bedroom, nine-bathroom, 11,368-square-foot Diablo compound next to Mount Diablo State Park.
Here’s the map from the San Francisco Chronicle to put it into perspective, and note the lack of water-wasters in the urban areas along the bay shore, from Richmond to Oakland:
And that’s just water. Electricity data are private (water, too, unless you get fined for a violation), but you can bet these people’s electricity and natural gas usage is off the charts, too. Not to mention their consumption of goods to supply their large homes, from furniture to other equipment.
So all in all, while we want to encourage more affordable housing in our cities, we definitely want to encourage rich people to live in them, too. It sure beats the water-guzzling, resource-hogging, sprawl-inducing alternative.
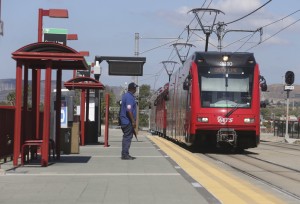
Voice of San Diego ran an excellent piece assessing San Diego’s Gillespie Field trolley stop, ranked in our recent study as the worst station neighborhood in all of California. As reporter Maya Srikrishnan reports:
Nearly 3,500 people live in the half-mile area surrounding that station, and about 4 percent of residents and 6 percent of workers take transit. Seven percent of the nearby residents don’t have their own vehicle.
To put those numbers in context, the stations in downtown, urban neighborhoods are surrounded by far more people, and a much larger share of them rely on transit. The half-mile area around the 12th and Imperial Station has a population of 9,529 (five times Gillespie Field), and about 31 percent of residents and 14 percent of workers use the trolley (seven times and three times more than Gillespie). About 26 percent of households in the half-mile radius don’t own vehicles, four times more than near Gillespie. The numbers are similar at the other high-ranking San Diego station at Civic Center.
I spent an hour last Wednesday morning – from 9 to 10 a.m. at the Gillespie station. Only one person got on a train. I had missed the commuter crowd, but the station’s parking lot wasn’t even half full. Our photographer spent 40 minutes taking pictures of the station on Tuesday and only two people boarded.
The next day, as people went home from work from nearby warehouses and manufacturing and other industrial companies around 5 p.m., the trolley station was a bit more crowded. But even during rush hour, a maximum of 10 people boarded any given train.
“It’s a good stop,” said Brittney Scott, who commutes from Lemon Grove on the trolley every day to her job at the House of Magnets warehouse – about a 10-minute walk from Gillespie Field Station. “Nice view, no one here.”
“This station is cleaner,” Scott said. “But it’s because no one uses it.”
It was always my hope that the study would motivate more attention on under-performing rail station neighborhoods. And the good news is that the East County Economic Development Council in San Diego may now try to implement a March 2015 plan to spur development in the area. According to the article, on Tuesday, the Council’s airport committee will review an agreement with a consultant to further develop plans for the area and seek partnerships with developers to implement the plan.
They cite the need for financing as one potential barrier, so this is a good area for state policy to help, perhaps through infrastructure finance districts or cap-and-trade funding. But it’s good to see local willingness to improve the area. That’s the crucial first step.
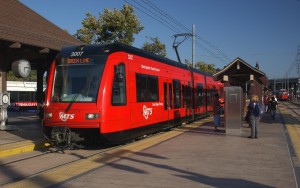 In the rail station area grades we released last week, two regions finished at the bottom of the heap in encouraging smart growth: Santa Clara and San Diego. I have to admit, I have not heard much of a response from people in the San Jose/Santa Clara area, which is surprising given how much the Bay Area prides itself on transit and connectivity.
But in San Diego, there’s been much coverage of the results (see my San Diego Union-Tribune op-ed in response, co-authored with Next 10’s F. Noel Perry, here). Unfortunately, much of it has been directed at San Diego MTS, as I blogged about last week. But Voice of San Diego grasped the implications of the low grades:
The study’s most critical conclusions weren’t directed at the Metropolitan Transit System or its stations. They keyed on decades of development decisions by the city of San Diego and other cities along the trolley lines.
It quantified a phenomenon that’s long been apparent anecdotally: Local leaders support smart growth – urban development that’s crucial for transit ridership – in theory, but not in practice.
They are not planning for or facilitating enough construction of walkable, affordable housing near transit access points.
Writer Andrew Keatts gives some specific examples of where local policies have thwarted transit-oriented development:
Last year, for instance, San Diego’s planning department released a study recommending the city increase the amount of development allowed at two new trolley stops planned as part of a $1.7 billion light-rail extension from Old Town to University City.
Residents revolted. They demanded the city not increase the 30-foot limit on new buildings near the station proposed for Clairemont Drive, or increase the number of homes that could be built in the area.
Mayor Kevin Faulconer quickly directed city staff to announce it wouldn’t raise the height limit.
I’m glad to see reporting on these kinds of instances, because these local decisions more than anything else determine the low scores of the station areas in places like San Diego. It will take some combination of public pressure and regulatory and financial incentives to overcome this dynamic.
Reaction to the station area grades that Berkeley Law and Next 10 released this week has been mixed, with some transit leaders celebrating good scores and others reacting defensively. Part of the problem is that the media played up the overall transit system average grades, which weren’t great, and didn’t emphasize (or comprehend) that the grades were about the 1/2 mile station areas — not the stations themselves.
Over at the Los Angeles Metro, blogger Steve Hymon raised some interesting questions about the grades for Metro:
I think the results are certainly interesting although not terribly surprising — visiting any of the stations in person gives you a fairly good idea how they’re performing. And let’s face it: tossing 11 factors into a blender to come up with a letter grade only gets you so far: the Gold Line’s Chinatown Station on the edge of downtown L.A. gets an A, but the 7th/Metro Station in the heart of DTLA gets an A-. The Gold Line’s Mariachi Plaza gets an A (perhaps because there is a big employer, a hospital, nearby) but the Gold Line’s South Pasadena Station gets a C-.
The South Pasadena Station is busy and has helped revitalize Mission Street. As I’ve noted in the past, it hasn’t attracted a ton of residential development, although the number of parcels available nearby are limited. The area around the station is largely residential and I don’t think anyone wants or expects serious commercial development nearby. Parking is limited. To my eye, the the station has been very successful — but gets dinged here, presumably, because it’s not near a ton of jobs.
His comments are worth a closer look. First, the Chinatown station versus 7th & Metro. Steve is right that at first glance, the results seem odd. Chinatown gets an A but 7th & Metro gets an A-, even though it’s in the heart of the rail system as a bustling station.
So I checked the breakdown, and the scores were close. Ultimately Chinatown scored better on key metrics like affordability, safety, and transit dependency (number of zero vehicle households in the 1/2 mile radius). But the other factor is that the Chinatown station was competing against other station areas in the “mixed” category (mixed between employment and residential), whereas 7th & Metro was competing in the much tougher “employment” category. Stations in that category tend to be in high-density downtowns like San Francisco, so it’s more difficult to get a good grade. 7the & Metro came close to an A though and still finished in the top quartile statewide.
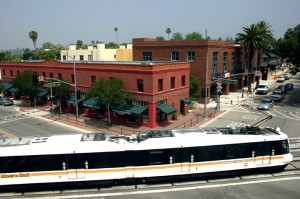
Second, I agree with Steve that the South Pasadena/Mission station on the Gold Line is a great station (photo above). It’s probably the prettiest and most well-designed in the system. So why did it get such a low score, with a C-?
The issue is not, as Steve suggests, about a lack of jobs or commercial development nearby. Instead, in looking at the data, the station area scored low because it was at the bottom for the percentage of people (workers and residents) within 1/2 mile who actually use transit. It also scored low for affordability in the area and for the percentage of people who don’t own a car. Otherwise, it scored well on transit quality, safety and walkability, among a few others.
So if South Pasadena leaders want to boost the Mission station score, they need to encourage people in the area to ride transit more. Certainly building more affordable housing nearby would help, as lower-income people tend to ride transit more often. And presumably the station will benefit from the opening of new lines like the Regional Connector and Expo, which might encourage more locals to ride transit to access more destinations.
But overall, the data reveal that the station area is not that competitive with other rail stations in its place type around the state. They also show that just building a few nice projects nearby is not enough to create a thriving, truly transit-oriented neighborhood. The neighborhood may be thriving, but not many people actually use transit.
Perhaps this station and others like it along the Gold Line, such as Del Mar, will benefit from a newer version of the report card. The 2010 census, on which much of the ridership data was based, does not capture the opening of new lines like Expo and the Gold Line eastside extension, and it doesn’t capture new transit riders moving into the neighborhood in the past few years.
But the data do not lie, and local leaders should explore ways to encourage more transit ridership in that station area if they want a better score in the future.
Anytime you grade someone poorly, you run the risk of getting them defensive. And in the case of San Diego’s rail transit station areas, the San Diego Metropolitan Transit System (MTS) has reason to be. In our statewide evaluation of rail transit station area performance, based on a variety of metrics like walkability, affordability, and local transit ridership, the data showed San Diego’s station areas to be the worst in the state on average.
MTS issued a statement defending its performance, according to the Times of San Diego:
The MTS released a statement that said the scorecard was narrow in scope, designed to support high-density neighborhoods and transit-oriented development. The criteria used is largely outside the control of MTS, according to the agency.The statement pointed out that an all-time high of more than 40 million passenger trips were logged on the trolley in the fiscal year completed June 30.
According to the study, the best performing Metropolitan Transit System stations in San Diego were the main 12th and Imperial stop in the East Village, and one on C Street in front of the City Administration Building in downtown San Diego. Both received B grades.
Grades of F were given to the following stations — Massachusetts Avenue in Lemon Grove, Santee Town Center, Spring Street in La Mesa, Fenton Parkway in Mission Valley, and the El Cajon Transit Center and Gillespie Field in El Cajon. The latter was named the worst station in the state because it is used by almost no nearby residents or workers, according to the study, while the MTS defended the stop as useful as a park-and-ride location for special events.
In some ways, I’m sympathetic to MTS. They are correct that they don’t have land use control over the station areas. Many of those stations were planned and built a long time ago. And the intent of the study was not to attack transit agencies, but to encourage primarily local and state leaders to improve under-performing areas.
That said, MTS does have leverage to improve station area performance, and I hope the agency uses it. The first step is admitting there is a problem, and it doesn’t seem like that has occurred, based on this report. Second, MTS could develop a policy to condition any future rail expansions on a local commitment to developing the station areas around the network. Third, MTS could consider reducing service to under-performing areas and redirecting those resources to better performing parts of the system. The agency could also use its leadership role to educate local leaders about the importance of improving station areas.
Ultimately, our report was not meant to demoralize transit leaders or make people feel that rail transit is a bad investment. It’s an important investment and necessary to California’s long-term economic and environmental success. But only if we get the land use piece of the equation right. And so far, San Diego still has work to do.
Yesterday was the anniversary of the 1986 groundbreaking on L.A.’s Red Line subway, for its initial 4.1 mile segment from downtown. On the video below, you see many of the prime actors who made L.A. rail happen, from Mayor Tom Bradley to transit officials like Marv Holen and Jan Hall.
What stands out to me though is how off some of the predictions were. Dyer, for example, predicted that in 40-50 years there would be “40-50 miles of subway,” with 110 miles of light rail. He thought they’d all be in place in 10 or 20 years. Instead, almost 30 years later we have only 18.6 miles of subway, with just a 4-mile extension in the immediate pipeline, moving at a literal glacial pace. The system with light rail included totals 87.7 miles, albeit with some new lines opening in the coming years.
But perhaps Dyer could be forgiven. Rail was new in Los Angeles at the time, and nobody anticipated how bogged down planning and construction would become. But it points to how painful it has become to implement these projects.
Meanwhile, enjoy this funky 80s video of the groundbreaking festivities:
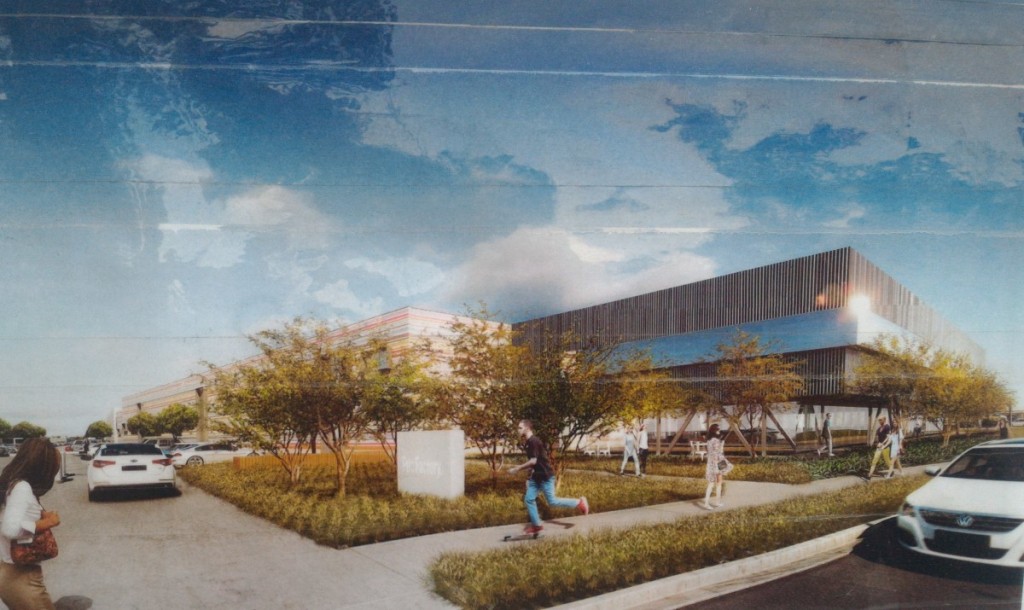 The sad saga of the doomed transit-oriented, pedestrian-friendly complex at the former Papermate site, adjacent to the new Santa Monica Expo Line, just got sadder.
After wealthy no-growthers in Santa Monica torpedoed the badly needed housing and office proposal, the new site owners are building a bunch of office lameness:
The Bergamot Transit Village saga is likely to end this week with a whimper as plans to turn the seven-acre site, once slated to become a mixed-use neighborhood across from the Expo Line 26th Street station, into a suburban-style office park continue to move forward.
The new plans, which the Architectural Review Board (ARB) will consider today, call for simply reoccupying the abandoned Papermate factory as office space as well as adding an additional 7,400 square feet to the existing buildings, bringing the total amount of office space to 204,000 square feet.
The plans will also add a one-story subterranean parking structure to the site, according the city’s website. It is still unclear if Clarion will add a sidewalk on the south side — facing the Expo Metro Rail station — of the parcel where there currently isn’t one. It also looks as though the new plans won’t be breaking up the superblock on which the former Papermate factory sits.
So no new housing, no pedestrian options, and no new neighborhood to take advantage of the multi-billion dollar transit line.
This outcome is a good example of how local politics is making California unaffordable and unlivable for future generations.
 As the California Legislature explores option to address the massive shortfall in funds for transportation infrastructure, a mileage-based fee appears to be off the table:
Higher gas and diesel taxes, revenue from the state’s cap-and-trade program, and increased vehicle license and registration fees are among the possible sources of new revenue included in a transportation-funding package of principles put forward Monday by a coalition of local government, business and labor groups.
Notably missing from the list of possible ways to generate $60 billion over 10 years: A system of charging people based on the miles they drive instead of the fuel they pump. Such a system is the focus of a pilot study that received $10.7 million in the current budget. Assembly Speaker Toni Atkins, D-San Diego, mentioned the idea earlier this year as an option for generating more transportation revenue. And starting last month, thousands of Oregon motorists began testing mileage-based taxes.
But supporters of the fee, of which I’m one, need not despair. This will be a challenging program to implement, and it makes sense to start with the pilot and then build expertise and support from there in the coming years. Over the long run, California will have to adopt this policy. Otherwise, gas tax revenue will continue to decline with inflation and improved fuel economy, while voters will prefer transportation infrastructure that doesn’t collapse.

