Tom Rubin, an anti-rail activist and former financial official for Southern California Rapid Transit District in the 1980s, penned a lengthy rebuttal [Word] to my blog post on Los Angeles transit ridership, which was in turn a rebuttal to the Los Angeles Times article on transit ridership trends since 1985. The comment is posted on the Antiplanner blog.
Mr. Rubin’s purpose, as he states it, is to:
respond to the contention Mr. Elkind expressed in the title of his piece and to demonstrate that, not only is [Times reporters] Ms. Nelson’s and Mr. Weikel’s article not misleading in stating that Metro ridership is down, in reality, the downward trend in ridership of the principal transit operator in Los Angeles is actually far worse than the Times article and the data in it makes it appear.
It’s worth reading his comment letter in full, although the basic point is straightforward: low fares mean higher ridership. His secondary point is that fares have increased in Los Angeles in part to subsidize a rail system that has failed to attract more riders over more cost-effective bus lines, if not cannibalize the bus lines and their riders completely. Here’s a key section:
Mr. Elkind dismisses the comparison of 2015 to 1985 ridership in Nelson and Weikel’s article by his statement, “The problem with the graph is that the reporters are cherry-picking the absolute high water mark of transit ridership in Los Angeles.”
That is not the “problem;” it is the main point – Los Angeles County was able to achieve this transit ridership high water mark very quickly, relatively simply, and very inexpensively by one main action – lower the fares. No other major city in the U.S. with a mature transit system has ever seen a three-year growth in transit ridership anything remotely close to SCRTD from 1982 to 1985 since at least the end of World War II – and remember, at the end of the three-year 50¢ program, ridership was still going up.
There’s a persuasive correlation between fares and ridership, and it’s fine to make that point. But my objection to the Times graph was that the reporters made it seem like 1985 was normalcy and an appropriate benchmark for comparing everything that came afterwards. But starting a graph from the absolute high point is by definition misleading.
And given Mr. Rubin’s point that 1985 was an important outlier, he too should object to the Times not including the prior years. If anything, those years bolster the point he’s trying to make that the fare decrease was working to boost ridership. And the full picture also would have put 1985 into perspective for casual readers, so they wouldn’t draw the wrong conclusions about rail and overall ridership.
And that brings me to my other objection to the Times article, which also applies to Mr. Rubin’s critiques, which is that they both seem to blame rail for the ridership woes in Los Angeles. Or at least in the case of the Times, imply that rail has made no dent in overall ridership.
As Mr. Rubin may know, the three-year bus fare reduction and freeze that he rightly celebrates was actually enabled by the advent of the rail program in Los Angeles. Proposition A in 1980, which passed with 54% of the vote to raise the sales tax for transit, contained a specific, voter-approved rail set aside, as well as the lowering of bus fares. The driving force for that initiative was Supervisor Kenneth Hahn, as I detail extensively in my book Railtown (for which I also happened to have interviewed Mr. Rubin). Mr. Hahn’s primary goal in pushing that initiative was to get a rail network started again in Los Angeles.
So without Hahn’s interest in rail, there would have been no initiative. And without an electoral coalition that included those voters in favor of rail but otherwise disinterested in buses, there would almost certainly have been no victory for that initiative and therefore no temporary reduction in bus fares for Mr. Rubin and other bus advocates (and riders, at the time) to celebrate.
Pitting bus versus rail is therefore a mistake in my view, as the above example indicates. Bus advocates have a common interest with rail enthusiasts in bolstering transit in Los Angeles, regardless of mode. That’s not to say that advocates shouldn’t be critical of wasteful spending. I’m certainly critical of the lack of development around rail transit stations in Los Angeles, which would make the existing system much more cost-effective and utilized. I’m also critical of specific rail routes (Green Line) and lack of rail in other routes (Wilshire corridor). And I’m critical of the long timelines and big price tags to build rail. But rail brings its own political constituency and funding pots to the table, many of which can be harnessed to benefit buses, too (although that’s admittedly not always the case).
Meanwhile, despite the billions spent on rail to date, which Mr. Rubin decries, I still believe that the system shouldn’t be judged fully until we get a comprehensive network in place and compact neighborhoods built around it. Given the size and scale of Los Angeles, the current lines are really just a half-built system. The Measure R projects now in the pipeline will go a long way toward filling in the critical corridor gaps, and their opening should improve the ridership picture (as well as provide other benefits). So the money that’s been spent to date could still garner ridership pay-offs, particularly once the Purple Line extension to Westwood opens.
The one big caveat is that we don’t know yet if local communities will accept the higher density around rail stations that is needed to make the system truly effective. So far the evidence is mixed, with a Santa Monica voter initiative to overturn a transit-oriented development and a new city-wide one to restrict density in general. But we see successes in places like downtown, Hollywood, Long Beach and Koreatown.
Finally, I note that Mr. Rubin takes issue with the comparison to climate change in my original blog post:
Mr. Elkind’s comment, “So choosing 1985 as your baseline is like climate change deniers choosing an unusually warm year in the 1990s to show that global warming hasn’t really been happening since then ” should be ignored.
….This discussion is not in the least similar to climate change, where there are still huge arguments over how much conditions are changing and what man-caused changes are causing this or not – the ridership facts are very clear, there is no argument about how much ridership has changed, and the causes are exceedingly obvious to any one who cares to look for them.
Given my work on climate change mitigation, I feel compelled to dispel any notion that there are “still huge arguments” over these issues, at least in the climate science community. The scientific consensus on the scale of the problem and the human-induced causation is overwhelming. Yes, there is debate about exactly what kind of extreme weather events will be most likely and where, but we know there will be some catastrophic changes in store for our civilization, particularly if we don’t transition soon to low-carbon energy.
But overall I’m glad to see the Times article spark an important debate about bus fares, ridership, and the future of cities like Los Angeles. Even if the original article was misleading and could have addressed the fare issue more directly.
Back in the 1970s, Los Angeles and San Francisco were at the top of the economic game for cities in America. At the time, the Bay Area was ranked first in income while Los Angeles was fourth.
But since then, Los Angeles has fallen to 25th, while San Francisco has surged, maintaining its top spot.
So what explains the difference? UCLA professor of urban planning Michael Storper and colleagues set about to examine the reasons in the new book The Rise and Fall of Urban Economies: Lessons from San Francisco and Los Angeles.
The book reads like a whodunit, but the bottom line explanation is that business leaders in the Bay Area continued to foster a connectedness and culture of innovation, while Los Angeles business leaders remained siloed and traditional (Storper’s slide show PDF here). Think Steve Jobs radicals mingling with financiers and traditional business leaders in the Bay Area.
The authors credit business organizations like the Bay Area Council for serving as collaborative, idea-sharing hubs for regional business leaders. But I also wonder if the region’s transportation links and business districts played a role. BART and the general centrality of the business districts in the Bay Area, from San Francisco’s financial district to Silicon Valley to downtown Oakland, allow professionals in the Bay Area to more easily congregate and mingle than in the more horizontally dense landscape of Los Angeles.
It’s perhaps another intangible benefit that could be achieved by Los Angeles expanding the Metro Rail network and building more offices near major transit stops.
You can see a snippet from Storper’s recent presentation at the Bay Area Council here:
Following my blog post last week in response to the Los Angeles Times story on falling transit ridership, the paper asked me to weigh in with an op-ed, published this morning:
If transit leaders want to improve ridership, they need to find ways to reduce fares and make them more equitable, such as by accounting for distance traveled and providing universal passes for students.
Local leaders can also improve service by allowing more bus-only lanes on major arterials and on freeways. These relatively low-cost options would make use of existing infrastructure and provide a huge time-savings to transit riders.
Given the stakes, it makes sense to prioritize passage for buses carrying more people than single-occupancy vehicles. And more people would take transit if they knew it would save them time compared to being stuck in traffic.
I’m hopeful that this hullabaloo about ridership will lead to some positive and overdue action to improve service and transit-oriented development in the region.
In response to the hullabaloo about long-term transit ridership in Los Angeles, transportation planner Jarrett Walker of Human Transport argues that the Los Angeles Times basic claim of ridership decline since 2006 is premature:
Sure, ridership is down 10% since 2006. But it’s up since 2011 and way up since 2004. Want to talk about the grand sweep of history? [Los Angeles Times reporter Laura] Nelson says that ridership is lower than it was 30 years ago, which sounds terrible, but it’s higher than it was 25 years ago! Thirty years ago, by the way, was fiscal year 1984-85, the year of the Olympics, so of course ridership was unusually high.
With a trendline like the one in the chart, you can say anything you want by comparing some past year to the present. Your conclusion is about the year you chose.
Walker makes the overall point that transit ridership in L.A. has been generally flat since 2006, “going up and down in about a 10% band, with no sign of strong movement in any direction.” He then tweeted in response to a Streetsblog LA article:
Again, we don't know yet that LA transit ridership is trending down. @StreetsblogLA @yfreemark @EthanElkind @latime https://t.co/fhIcqBMs6R
— Jarrett Walker (@humantransit) January 30, 2016
I share Walker’s concern about cherry-picking baseline years (although his point about the 1984 Olympics boosting ridership that fiscal year is actually not true — the few million extra riders for the Olympics was a drop in the overall bucket [PDF] — h/t Henry Fung).
But is it really too soon to start identifying recent trends in ridership patterns? Particularly when you look at the historical context for the trends over the long term, the recent dip may not be as indeterminate as Walker makes it sound.
Bus rider advocates have been making the point for years now that ridership trends are directly correlated to fare increases or decreases. And as someone who has studied the history of rail transit policies in Los Angeles for the book Railtown, I find their evidence compelling. For example, take Robert Garcia’s 2012 post on ridership trends, in which he uses data from longtime rail critic Tom Rubin to argue:
There are five clear periods of ridership change in the 34 years up to the current fiscal year. In the three periods when fares were increased, bus service was reduced, and the emphasis was on spending as much money as possible on rail, total riders dropped significantly. In the two periods when the fares were reduced or held constant and the quantity and quality of service improved, ridership increased hugely — even when MTA was spending half of its funding on rail to carry under 20% of the riders.
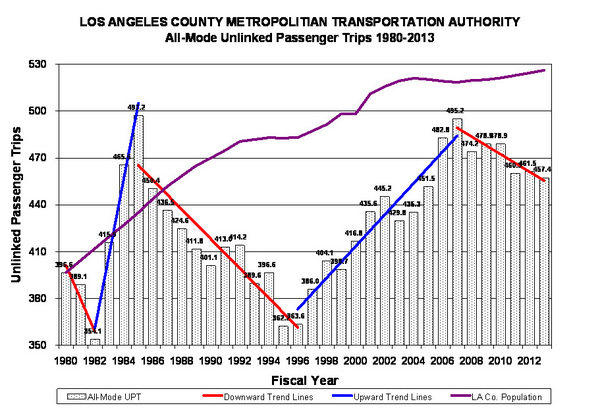
Here’s the chart to illustrate the point:
The 5 periods of transit ridership changes correspond to 1) rising fares until 1982 when 2) the three-year fare decrease from a 1980 ballot measure went into effect from 1982-1985, 3) fare increases following 1985 until 4) the famous Bus Riders Union-MTA consent decree in effect from 1996 to 2006 kept fares steady, and then 5) rising fares since 2007 leading to the present downward trend.
While the trend lines on the chart above may not be super precise, they do lend credence to the idea that fares are potentially the major factor determining ridership. And they are often a proxy for larger economic trends, as recessions squeeze transit budgets which too often leads transit agencies to raise fares. They also indicate that it may not be too soon to start identifying a recent trend, contra Walker, given the historical pattern.
If this is true, and we care about maximizing ridership, then Metro’s first response to the latest ridership decreases should be to re-examine the fare structure. And in the long-term, the agency should focus on improved bus service through bus-only lanes and encouraging local governments to build more affordable housing and offices near rail stops.
There’s a lot of hand-wringing in transit circles in Los Angeles today, as the Los Angeles Times just ran a piece documenting the decline in transit ridership in Los Angeles, despite some big investments in rail:
The Los Angeles County Metropolitan Transportation Authority, the region’s largest carrier, lost more than 10% of its boardings from 2006 to 2015, a decline that appears to be accelerating. Despite a $9-billion investment in new light rail and subway lines, Metro now has fewer boardings than it did three decades ago, when buses were the county’s only transit option.
The article notes that the trend is happening nationwide and suggests multiple factors at play, such as “a changing job market, falling gas prices, fare increases, declining immigration and the growing popularity of other transportation options, including bicycling and ride-hailing companies such as Uber and Lyft.”
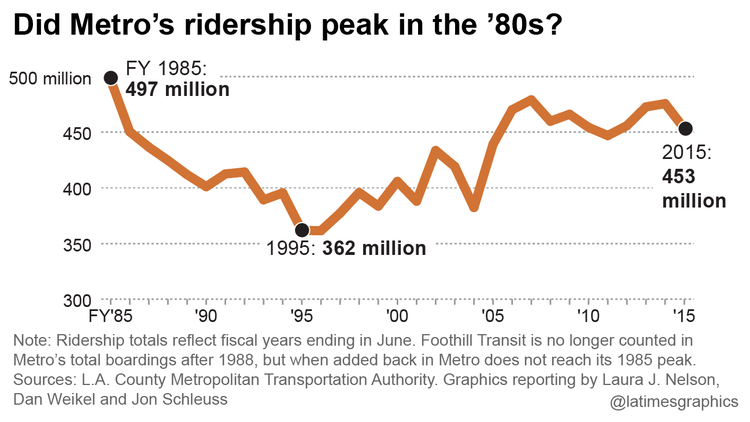
While the article highlights an important issue and puts it in a nationwide context, reporters Laura Nelson and Dan Weikel presented some misleading figures on Los Angeles ridership patterns. It starts with this graph illustrating the decline:
The problem with the graph is that the reporters are cherry-picking the absolute high water mark of transit ridership in Los Angeles.
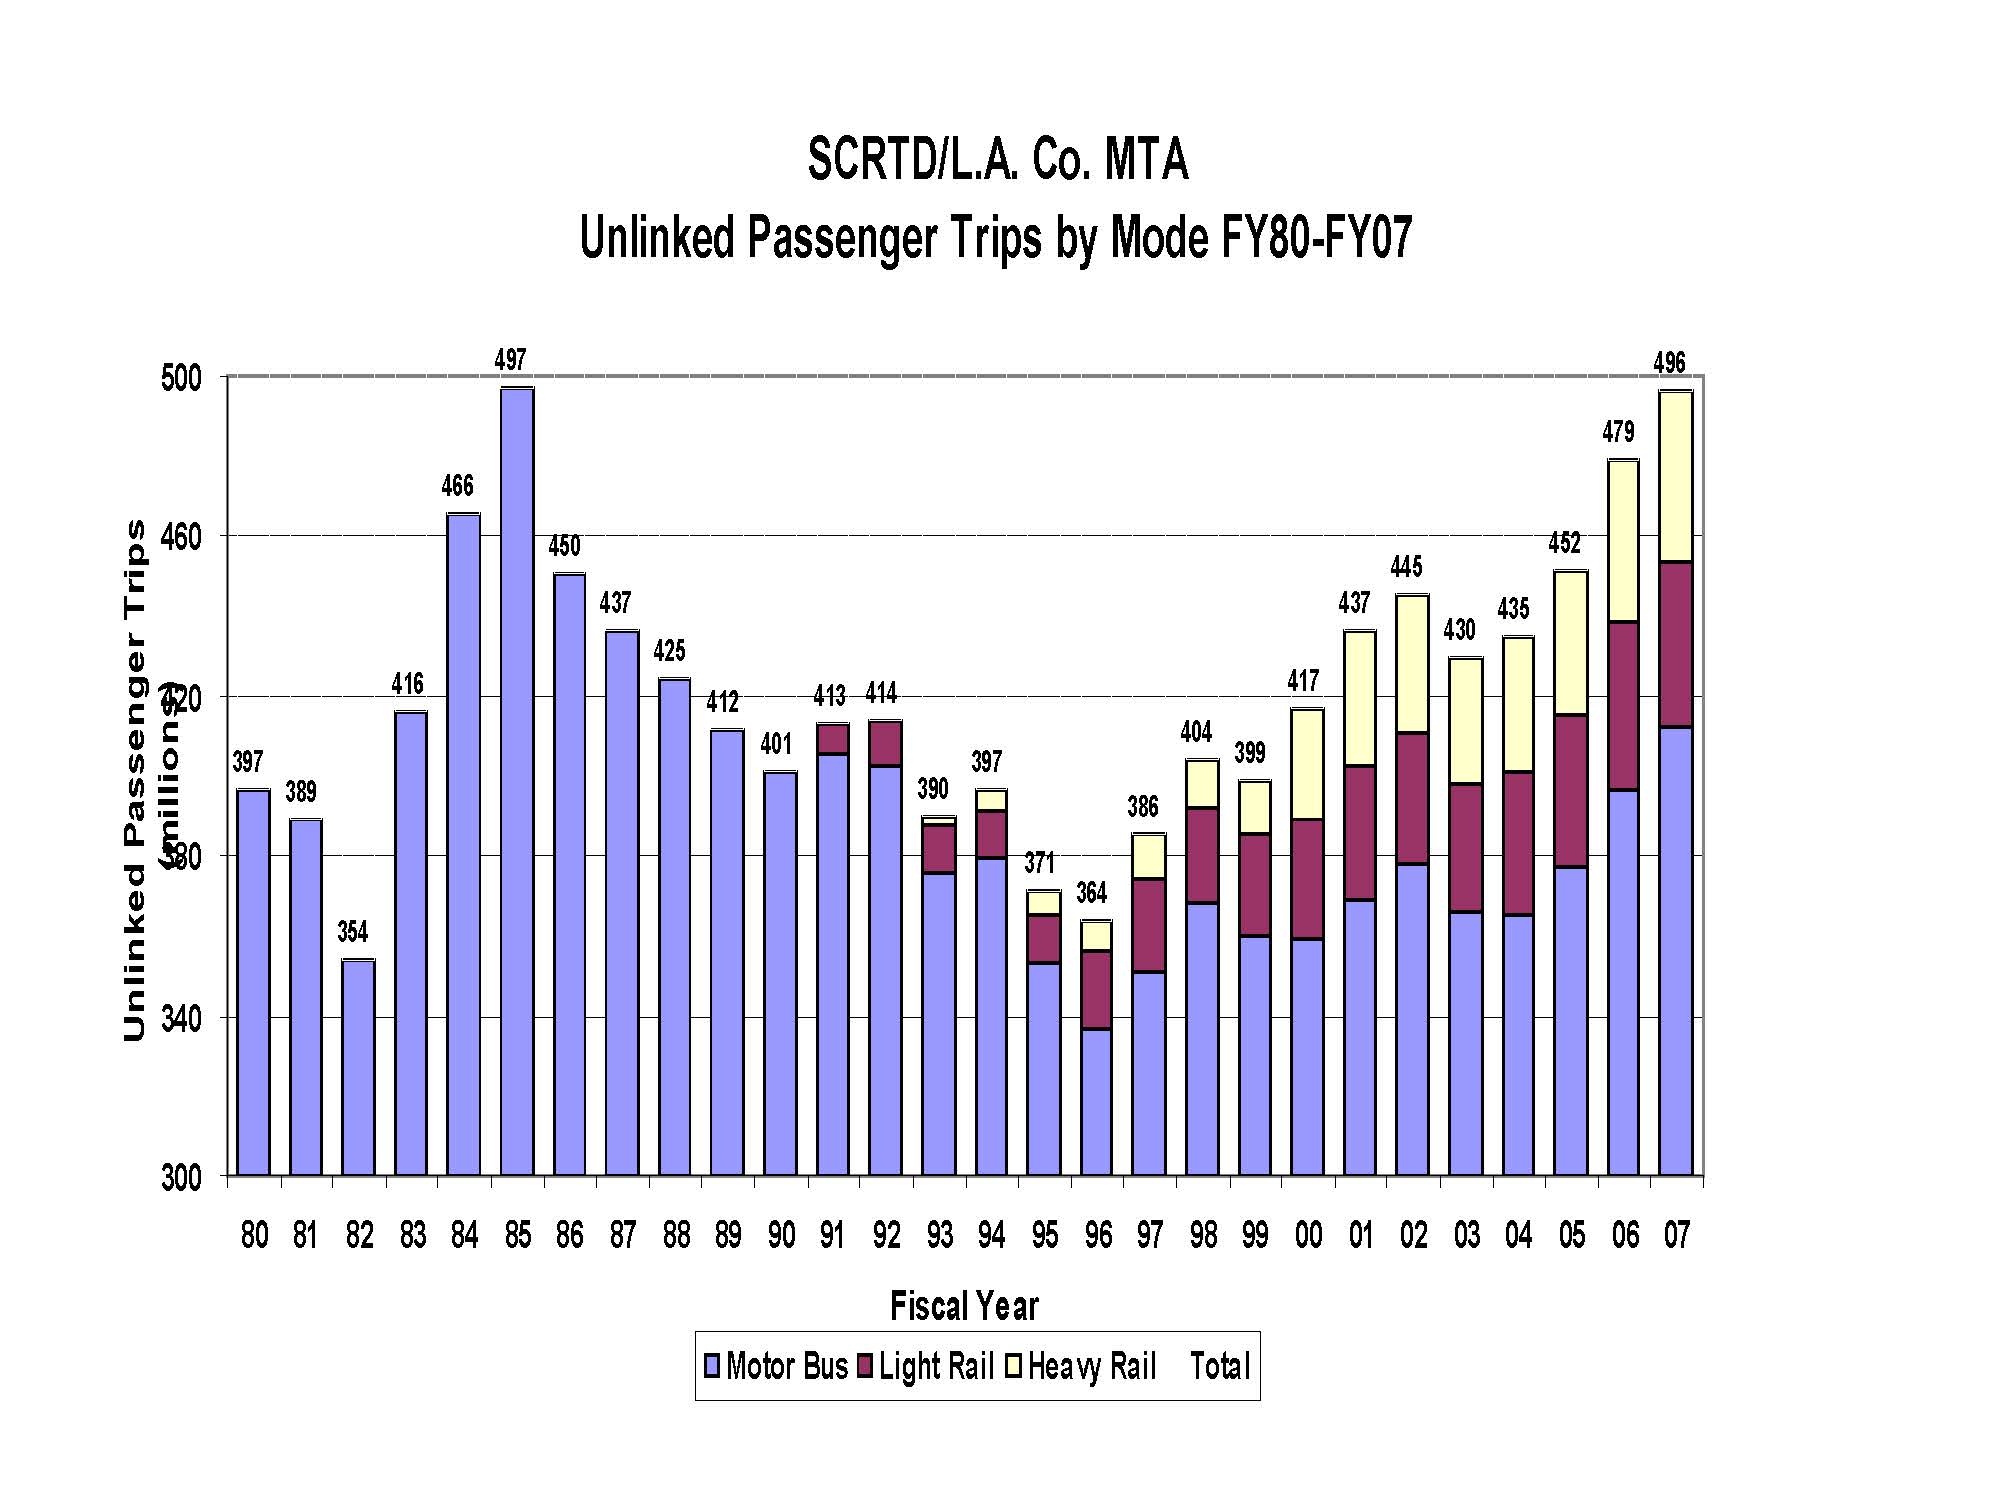
As I describe in the book Railtown, Los Angeles County voters approved a sales tax measure in 1980 that not only launched the rail system in L.A., it kept bus fares to 50 cents for three years. That reduction in fares sparked a temporary and significant spike in ridership, as this graph of ridership from 1980 to 2007 illustrates:
So choosing 1985 as your baseline is like climate change deniers choosing an unusually warm year in the 1990s to show that global warming hasn’t really been happening since then.
In addition, the article is a bit unfair to Metro in citing the billions of dollars that have been invested in rail during this period of declining ridership. Sure, since 2006 the region has been spending a lot of money on rail, but those investments have not yet resulted in actual, open rail lines. Since that year, only the East Side Gold Line and half of the Expo Line (to Culver City) have opened.
Meanwhile, Expo to Santa Monica and the Gold Line extension to Azusa are on deck to open this year, while Crenshaw, the downtown Regional Connector and the subway extension down Wilshire are all under construction. Once they open, the region will only then see the true return on that investment.
I’m certainly glad that the Times is highlighting this important issue, and I’m hopeful it will spark calls to address it. One easy way to do so would be to lower fares, as the 1980s experience proves. Another way would be to build a lot more jobs and housing near rail transit stations, as we’ve documented in a recent report from Berkeley Law and Next 10.
But we shouldn’t let reports like these undermine the case for finishing the job of building out L.A’s rail system. The region is only halfway done, and with these new projects under construction and more attention paid to the station neighborhoods, the ridership numbers will surely increase from this temporary — albeit disheartening — setback.
I continue to be encouraged by the reaction of San Diego leaders to our report last month grading California’s rail transit station neighborhoods. San Diego overall did not perform well, and now major media outlets like the NBC affiliate there are focused on the problem. Here’s a recent story they aired, including a short profile of Gillespie Field, the worst-performing station neighborhood in the state:
This educational effort couldn’t come at a better time. The region is now contemplating a new transportation plan and at the same time is battling with local environmental groups and the state attorney general in the state Supreme Court over their last super-crappy plan. So we need more information about the transit-oriented development opportunities there to enter the public discourse, through stories like this one.
The land use and transportation news out of Los Angeles yesterday was head-shaking. On land use, per the Los Angeles Times, wealthy NIMBYs are bank-rolling a voter initiative essentially to freeze development in Los Angeles:
The Coalition to Preserve L.A. announced plans for a ballot measure, titled the Neighborhood Integrity Initiative, that would put a moratorium of up to 24 months on development projects that cannot be built without votes from elected officials to increase density.
The proposal also would make it harder for those officials to change the city’s General Plan — the document that spells out the city’s policies on land use and traffic — for individual real estate developments.
You can read the text here. As my colleague Jonathan Zasloff rightfully describes it, it’s “NIMBYs gone wild.” The last thing an overpriced and supply-constrained region like Los Angeles needs is less housing, especially near transit stops in places like Hollywood.
Meanwhile, on transportation, the libertarian Reason Foundation came out with an equally retrograde proposal [PDF], advocating for over $700 billion in new transportation spending in Los Angeles, primarily for roadway expansion. About half of those funds would come from toll revenue. Because we all know that expanding capacity on roadways is an excellent long-term solution to solve traffic (even CalTrans now admits that expansion just induces more demand).
Even worse, most of the capacity expansion would happen via tunnels underneath existing roadways, which are hugely disruptive, difficult to build, and not likely to get approved by our byzantine power structure. The only decent part of the report is the emphasis on bus-only lanes and greater use of congestion pricing in highway lanes, with the revenue going to transit.
All in all, a tough day for sensible proposals on land use and transportation in Los Angeles.
I’m all in favor of abundant housing in California’s major metropolitan areas. We need it to meet demand and reduce economic inequality. But to solve our congestion problems and bolster our transit networks, we need that housing to be built in the right places.
Along these lines, Robert Cervero, Friesen Chair of Urban Studies and professor of City and Regional Planning at UC Berkeley, has a fascinating (but long) presentation on-line that describes the recipe for successful, functional cities:
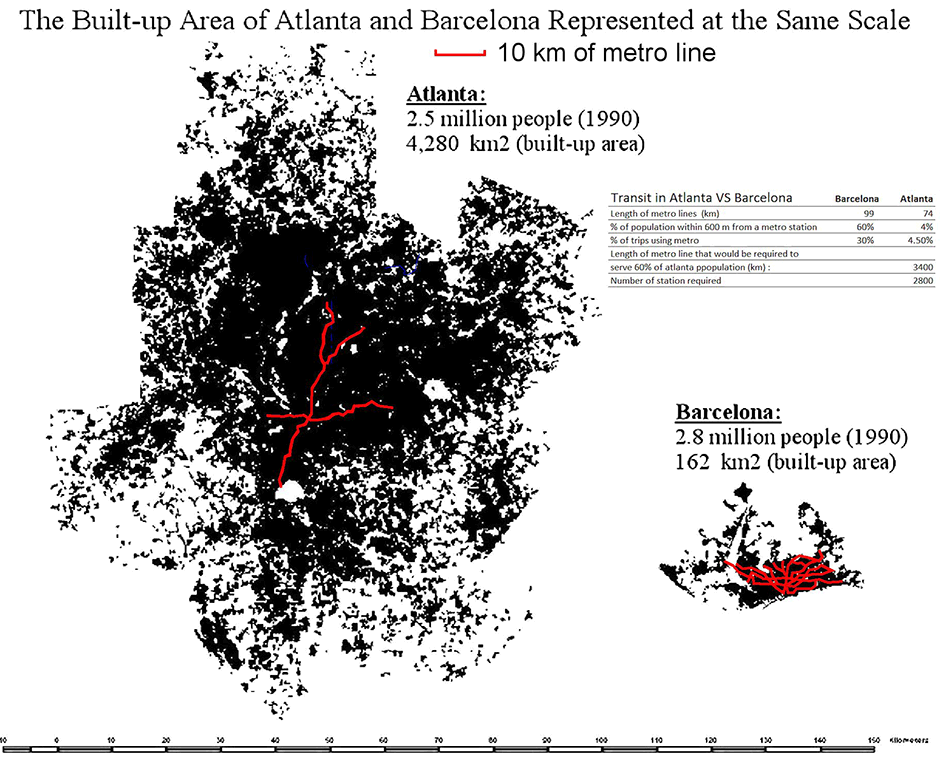
The bottom line is that density by itself doesn’t work unless it is well-planned and co-located with high quality transit. Good examples of bad density? Sao Paulo and Los Angeles, where the density is spread across the landscape and average per capita travel times are long. Examples of good density? Curitiba, Brazil, where density is located in “transit-sheds” along boulevards with bus rapid transit and per capita travel times are relatively short.
For Los Angeles in particular, the path forward will be essentially to retrofit the city by building a new, more functional one on top of the old. That means abundant housing along the new rail network and major bus routes, but probably not anywhere else at this point.
As an interesting concluding note, Cervero describes how most urban growth in the world will occur in the “Global South,” making these lessons critical for new cities as they are designed and built.

