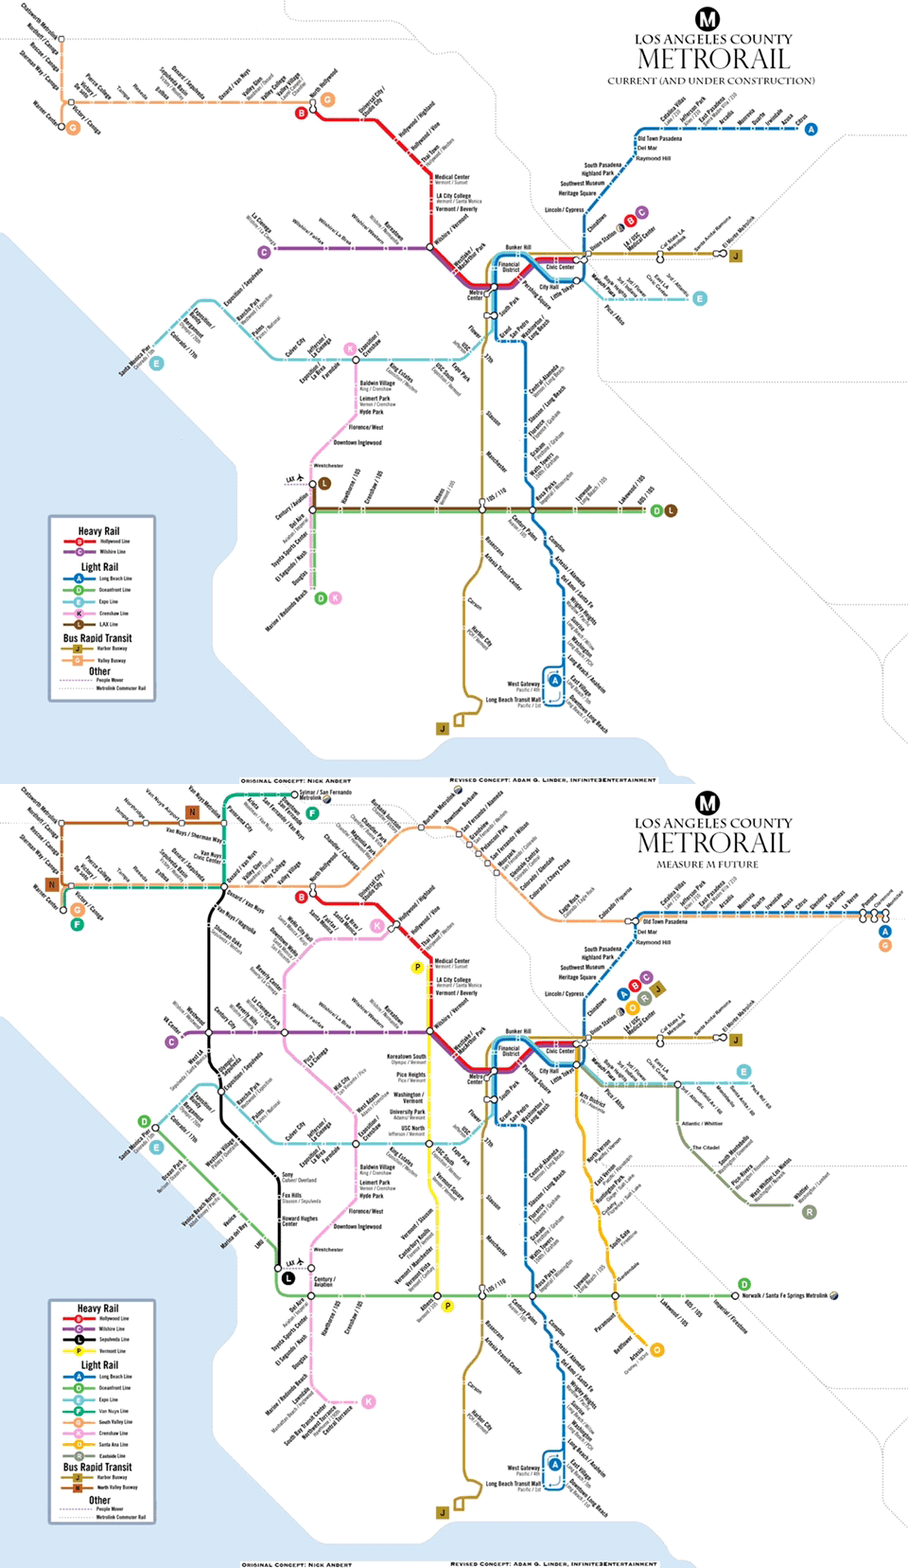
With a region as big as Los Angeles, it can be tough to visualize how new transit projects will fit into the landscape. And now that Measure M is on the ballot this November, a whole host of new projects are potentially at stake to add to the mix.
To make it easy for voters to visualize, amateur map-maker Adam Linder developed his own blinking GIF map, which has caught on with outlets like Curbed LA:
Adam describes why he developed the map in this interview with KPCC radio last week. Apparently my book Railtown was an inspiration for him to get into this issue, which is gratifying to hear. His map follows another one put together by a transportation consultant earlier this summer.
As the region contemplates Measure M this fall, grassroots efforts like these may end up making a big difference in swaying voters.
Leave a Reply
You must be logged in to post a comment.


