We don’t need rail transit systems to make money. None of them do, and neither do roadways for that matter (gas taxes pay for most of that infrastructure).
What’s more, rail transit systems have huge economic and environmental benefits that aren’t captured in the fares. They can mean less driving, more downtown and station-area investment, less pollution, and better quality of life. Plus they provide convenient alternatives for those who don’t or can’t drive.
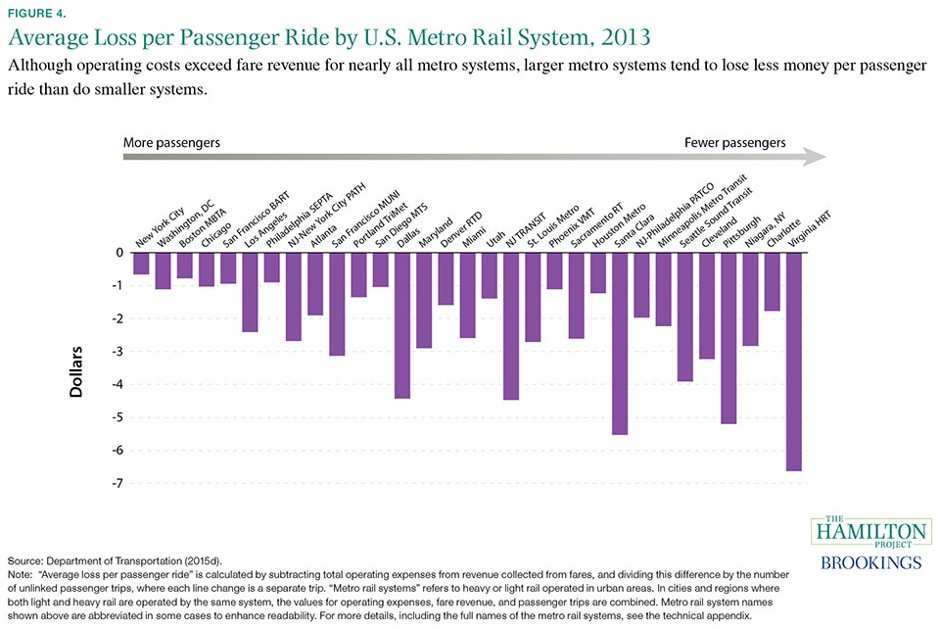
But that doesn’t mean we shouldn’t care about how cost effective these systems are. To that end, Eric Jaffe at CityLab points to a Hamilton Project chart showing how much the major rail transit systems in the U.S. lose:

Some interesting things jump out at me from the chart:
- Los Angeles is a bit of an outlier (in a bad way) with relatively high ridership but heavy losses compared to its nearby peers, like BART and the Philadelphia system. My guess it’s related to the lack of distance-based fares on the trains, as people can take long rides on LA rail but pay as if they just went one stop.
- San Francisco’s MUNI system is a surprising money loser. Those trains are packed, so I’m not sure what the problem is. It could be high operating expenses, rather than a revenue problem. The same dynamic could also be affecting New Jersey transit and New York’s PATH.
- Santa Clara’s VTA is one of the worst in the country. Not surprising. We graded it and its station-area development harshly in our 2015 report comparing California urban rail transit systems and their station neighborhoods (although San Diego’s system also graded poorly but does not have heavy losses, per this chart).
The bottom line: transit systems need to keep their operating expenses down while boosting revenue. My guess is operating costs are mostly about labor and security expenses. But regardless, a straightforward way to boost revenue is to increase ridership by serving only densely populated neighborhoods.
If transit systems can achieve those two goals, they’ll rate highly on charts like these.


