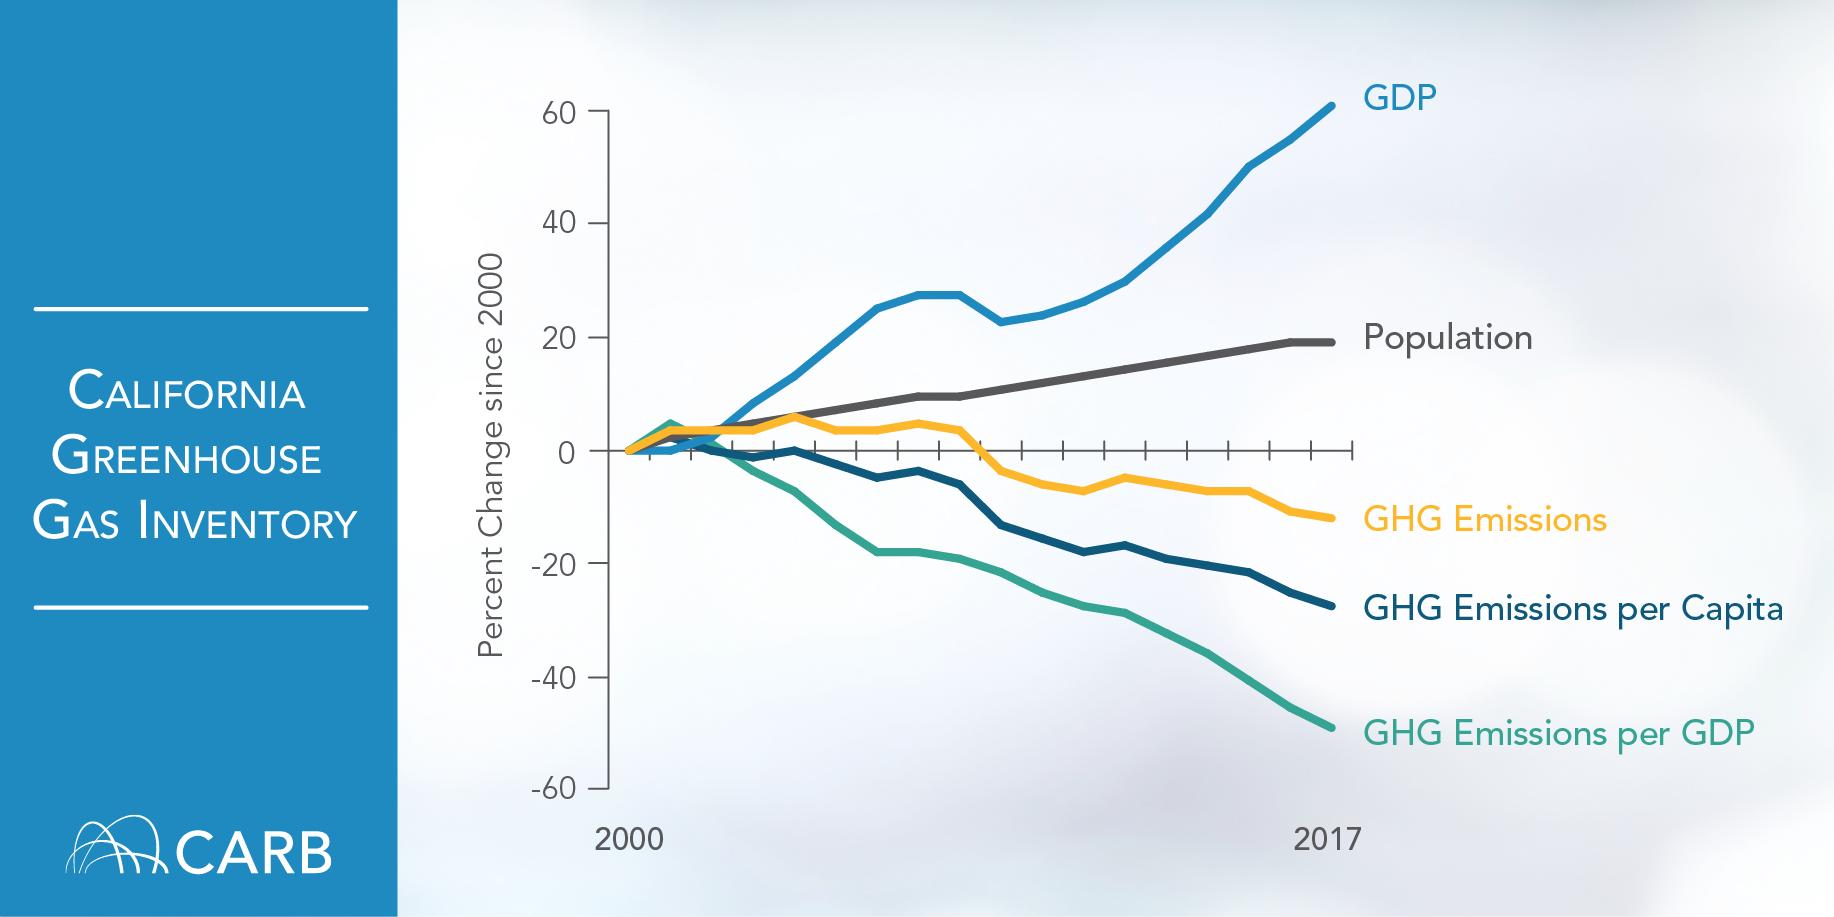
Good news on California’s efforts to fight climate change: in-state emissions in 2017 (the latest available data) were down over 2016 and ahead of the state’s mandatory 2020 goals. The California Air Resources Board announced the progress yesterday, with this chart showing emissions in context of population and GDP:

Overall, emissions totaled 424 million metric tons of carbon dioxide equivalent in 2017, down 5 million metric tons from 2016. For reference, the 2020 reduction target is 431 million metric tons.
Most of the progress came from the electricity sector, where for the first time renewable sources made up a larger percentage of the generation than fossil fuels.
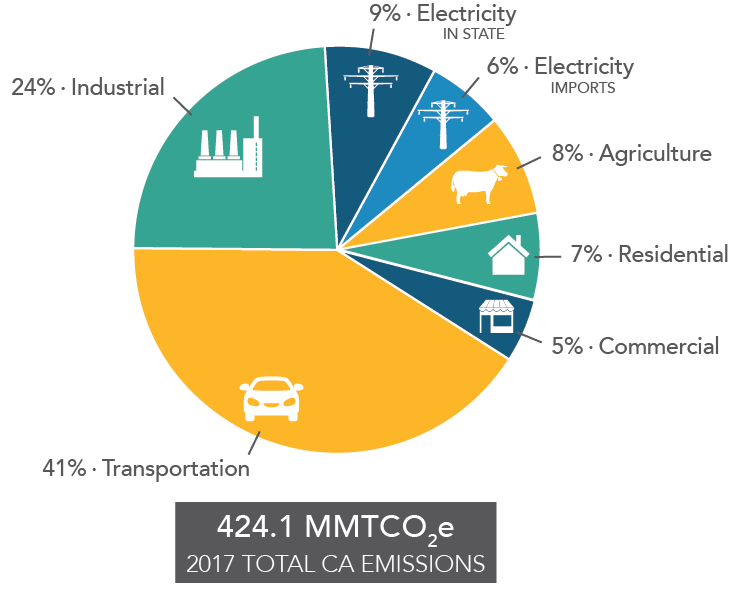
However, transportation emissions increased 0.7% in 2017, compared to a 2% increase in 2016, mostly from passenger vehicles. That total is even worse when you consider pollution from oil and gas refineries that make the fuel for these passenger vehicles. Together with hydrogen production, these sources constituted one-third of the state’s total industrial pollution.
Here’s the latest pie chart on where the emissions came from in 2017:

While the story is overall positive for California’s climate efforts, the state will have to redouble its efforts to reduce driving miles by allowing more homes to be built near jobs and transit, while transitioning the remaining driving miles to zero-emission technologies like electric vehicles.


